





Somewhere in your SaaS bill right now, a five-figure number is hiding in plain sight. Not fraud. Not a billing error. Just licenses nobody uses, tools two departments bought separately for the same job, and renewals that auto-billed because nobody was watching the calendar. This is not a hypothetical. It is the default state of enterprise software spend in 2026, and the range is predictable enough to calculate before you even run an audit.
This article walks through where that money actually goes, how to size the number for your own company, and a practical sequence for turning SaaS cost optimization from a one-time cleanup into a permanent, cost-effective discipline. If you want the fuller picture first, our free guide on tool sprawl breaks down exactly how this shows up across engineering, finance, and reporting.
What You Will Learn
- Exactly where the $50K-$200K figure comes from and how to calculate your own exposure
- The five biggest sources of SaaS waste, ranked by typical impact
- A step-by-step optimization sequence that avoids the second-quarter backlash
- What to look for in a SaaS optimization tool versus what to handle with process alone
- Common mistakes that cause savings to evaporate within a year
Where The $50K-$200K Figure Comes From
The math is simple once you have two inputs: your total annual SaaS spend, and the percentage that structured optimization typically recovers.
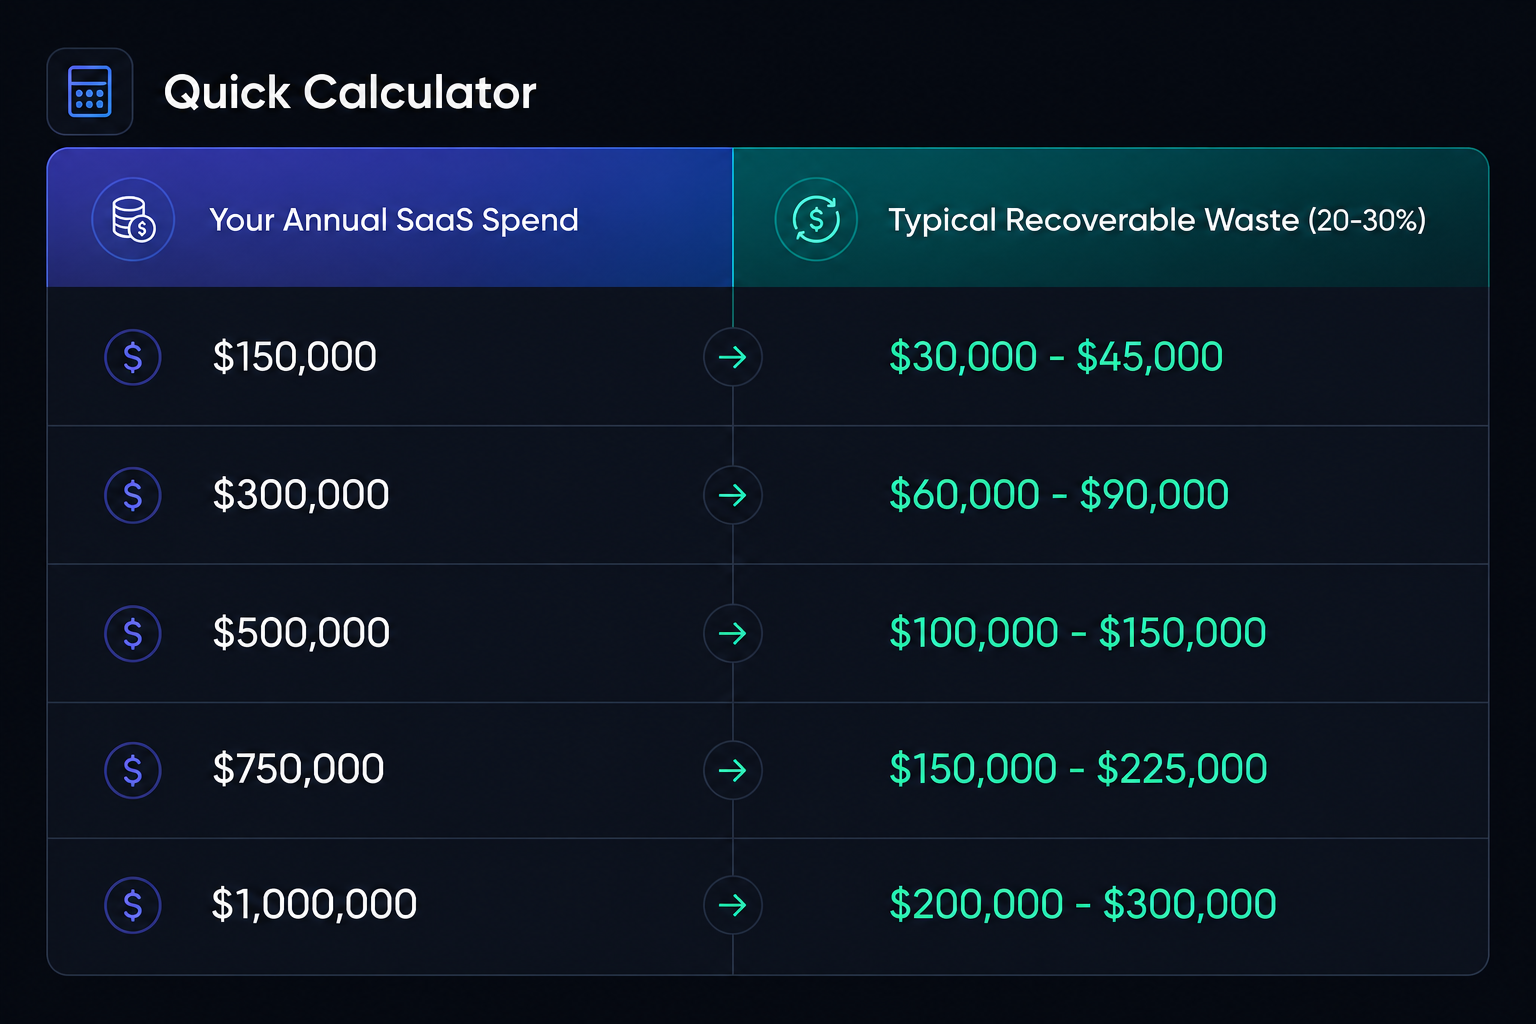
Industry benchmarks consistently show that companies recover between 20% and 30% of their SaaS budget through a structured optimization process. For a company spending $200,000 to $700,000 a year on software, a range most mid-market and lower-enterprise companies fall into, that recovery works out to roughly $40,000 to $210,000 annually (Source: Corma, SaaS Spend Optimization Guide, 2026). Larger organizations move well past that range. Enterprises now spend an average of $55.7 million annually on SaaS, with only 54% of licenses actually used, resulting in an estimated $19.8 million in wasted spend at the high end of the market (Source: Varisource, 2026 Complete Guide to Cost Savings). It is the same kind of gap we help clients quantify when we build a real total cost of ownership case in our AWS TCO calculator breakdown, just applied to software licensing instead of infrastructure.
The lower end of the $50K-$200K estimate assumes a leaner, more disciplined starting point. The higher end assumes what most companies actually have: sprawl nobody has fully mapped. This is the same range we break down in detail, tool by tool, in our free guide on fixing tool sprawl.
Here is what that recovery range looks like at a few different spend levels.
Where The Money Actually Leaks
Five patterns show up again and again once a company actually maps its SaaS portfolio.
1. Unused And Underutilized Licenses
This is consistently the largest single source of waste, typically accounting for a quarter to nearly a third of total SaaS spend. Seats get provisioned for a project, the project ends, and the license quietly renews for a year because nobody was assigned to catch it.
2. Shadow IT
Applications purchased outside IT and procurement oversight now make up a large share of the average company's total application count. One 2026 benchmark puts shadow IT at 42% of all SaaS applications in the average company, purchased on corporate cards, expensed departmentally, or converted from a free trial nobody remembered to cancel (Source: Varisource, 2026). A separate analysis found employee-driven purchases represent a small share of total spend but a disproportionate share of applications in use, meaning a large part of the portfolio sits entirely outside centralized visibility.
3. Redundant Tools
The most commonly duplicated categories are online training, project management, and team collaboration tools, where multiple departments independently buy software that does effectively the same job. Every duplicate is a full second contract, a second renewal date, and a second attack surface.
4. Auto-Renewals On Underused Contracts
With companies averaging well over 200 SaaS renewals a year, close to one every business day, it is easy for a low-usage tool to auto-renew simply because reviewing it never made it onto anyone's calendar. The same discipline that catches this also applies to infrastructure decisions, which is part of why we walk clients through when moving workloads back on-premise actually makes sense before a contract auto-renews on assumptions nobody re-checked.
5. Vendor Overpricing
Benchmarking data from IT spend analysis firm NPI, which reviews over $40 billion in enterprise IT spend annually, found more than 85% of vendor quotes came in above fair market value, meaning most companies are overpaying simply because they lack a pricing benchmark to negotiate against (Source: Varisource, 2026, citing NPI).
Here is how the two most common optimization approaches compare over a year.
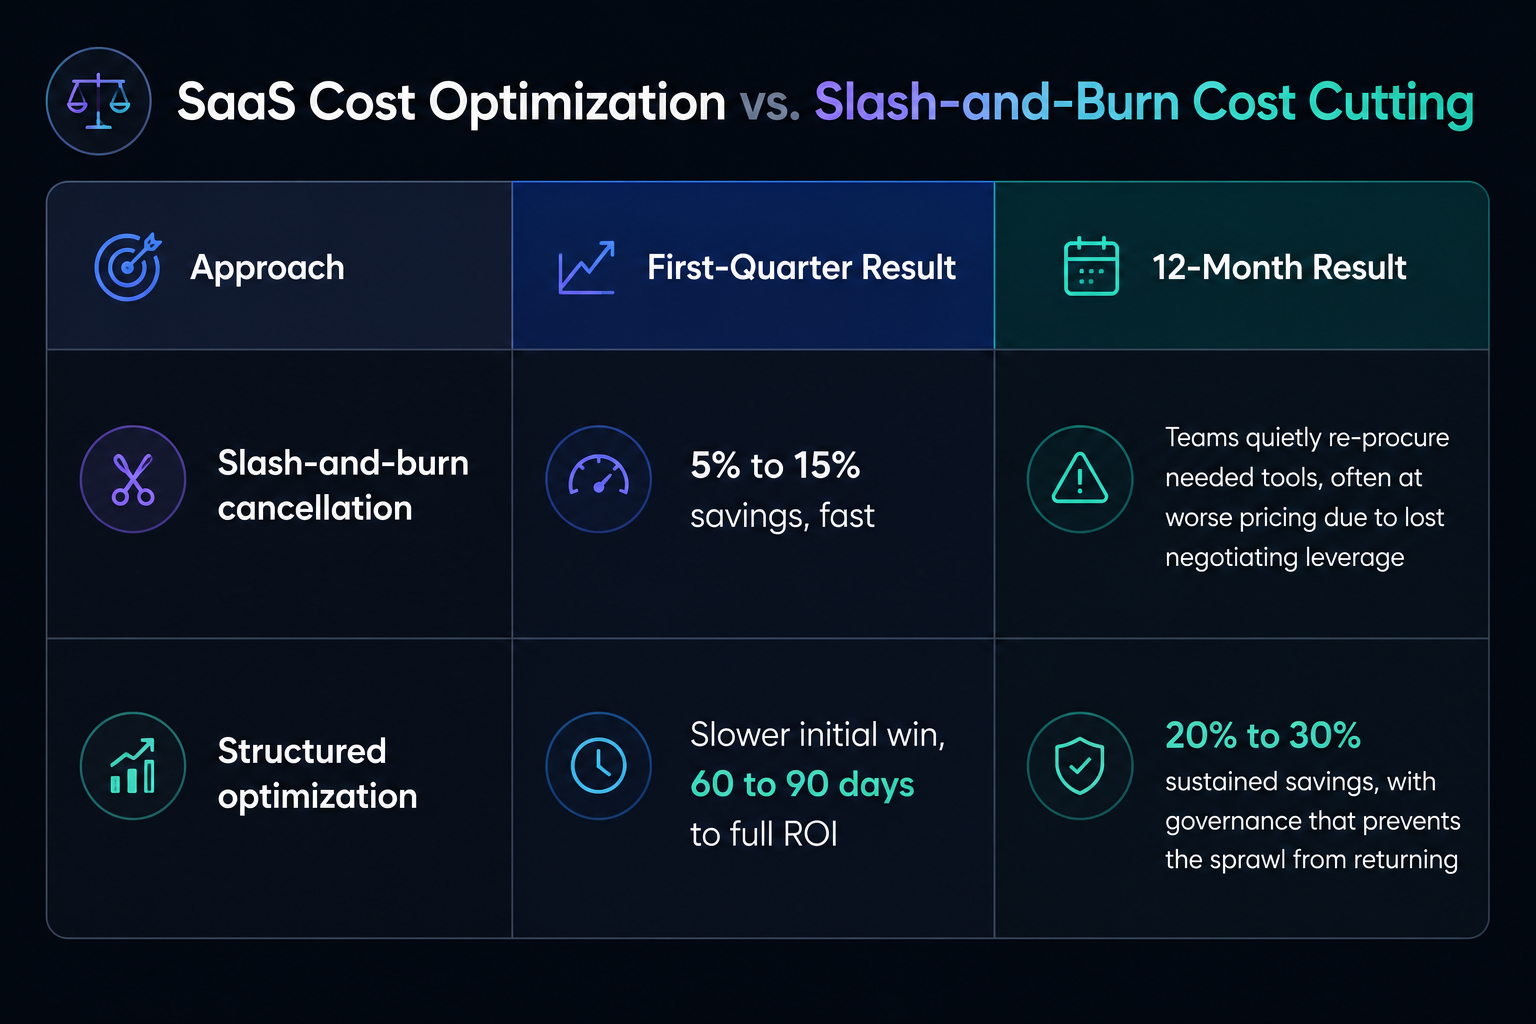
The pattern is consistent across enterprise SaaS research: cancellation-first strategies produce a short-term win followed by renewed shadow IT, while structured consolidation builds a portfolio that finance can audit and that business teams stay on board with.
Step-By-Step - A Cost-Effective SaaS Optimization Sequence
Here is the sequence that tends to hold up in practice, in the order it should actually happen.
Step 1 - Build The Full Inventory, Including Shadow IT
List every tool, owner, cost, renewal date, and active user count. Pull this from finance records and expense reports, not just IT's approved list, since IT typically controls only a small share of total SaaS spend and applications in use.
Step 2 - Analyze Usage, Not Just Spend
Pull adoption metrics per tool and flag anything running below 60% to 70% utilization. A tool costing $500 a month with 90% adoption is doing its job. A tool costing $50 a month with 5% adoption is a candidate for cancellation regardless of price.
Step 3 - Prioritize Quick Wins
Target the highest-cost, lowest-value applications first. Cancel outright, downgrade seat counts, or consolidate into an existing tool that already covers the same function.
Step 4 - Negotiate From Strength
Go into renewal conversations with your own usage data and market pricing benchmarks in hand, ideally starting the conversation 90 to 120 days before the renewal date rather than the week it lands.
Step 5 - Rightsize Licenses On A Recurring Cadence
Reclaim unused seats quarterly rather than annually. Automate alerts for accounts with no login activity in 30 or 60 days.
Step 6 - Set Governance Guardrails
Require business justification and a lightweight IT or finance approval step for any new SaaS purchase above a defined threshold. This single step is what prevents the stack from sprawling back to where it started, and it is usually the point where a broader cloud strategy and design conversation becomes worth having, since the same governance gap tends to show up in infrastructure spend too.
Step 7 - Monitor Monthly, Review Quarterly
Treat this as an ongoing discipline, not a one-time project. Review spend monthly and run a full portfolio review each quarter.
When To Bring In A SaaS Optimization Tool
A spreadsheet works for the first pass on a portfolio under roughly 30 to 50 applications. Past that point, most teams need a dedicated SaaS optimization tool that connects to SSO, HR, and finance systems to map usage automatically rather than chasing it manually. That kind of centralized visibility is the same foundation that powers strategic growth through enterprise business intelligence, just pointed at your software portfolio instead of your revenue data.
Here is what actually matters when evaluating a platform.
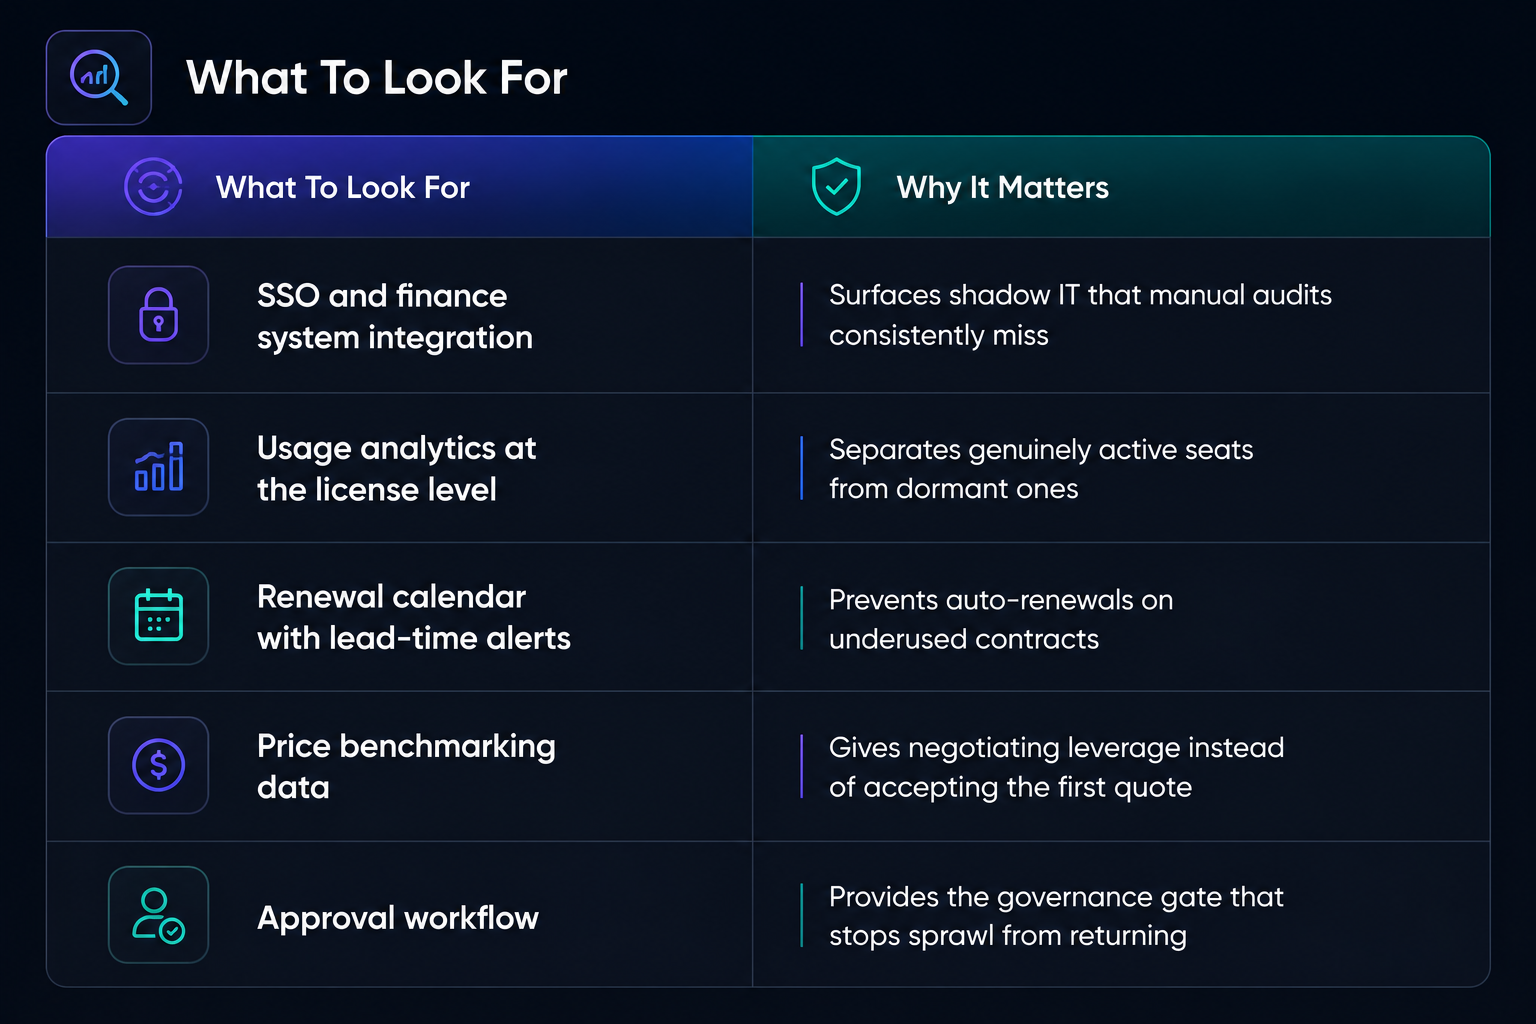
Most organizations see measurable ROI from a dedicated platform within 60 to 90 days, with the initial license reclaim alone often exceeding the platform's own cost in the first quarter.
Common Mistakes
- Auditing only IT-approved tools. This misses a large share of applications sitting in shadow IT, which is exactly where the biggest surprises usually live.
- Focusing on price instead of value. Sometimes paying more for one consolidated platform that replaces three point solutions is the cheaper outcome overall.
- Cutting before classifying. Cancel a tool a team actually depends on and you will pay for it twice, once in lost productivity, once in the worse pricing you get when they re-buy it later.
- Treating optimization as a one-time project. Without a recurring review cadence and a purchasing guardrail, a cleaned-up stack drifts back toward sprawl within a year.
- Skipping cross-functional ownership. Optimization that lives only in IT stalls, since business units now control the majority of purchasing decisions. A standing review with IT, finance, and business leads keeps the process moving.
Best Practices
- Run the inventory audit against finance and expense records, not just IT's system of record
- Set a utilization threshold, typically 60% to 70%, below which a tool is flagged automatically for review
- Start renewal negotiations 90 to 120 days out with usage data and pricing benchmarks in hand
- Require lightweight approval for new purchases above a defined spend threshold
- Review the full portfolio quarterly, not annually
What Finance And IT Leaders Want To Know
How much money does the average company waste on SaaS? Estimates vary by company size, but structured optimization typically recovers 20% to 30% of total SaaS spend. For a mid-market company spending $200,000 to $700,000 a year, that works out to roughly $50,000 to $200,000 in recoverable waste.
What percentage of SaaS licenses go unused? Industry research puts average license utilization at around 54%, meaning close to half of purchased licenses see little or no active use (Source: Varisource, 2026).
What is shadow IT and why does it matter for cost optimization? Shadow IT refers to software purchased or adopted outside IT and procurement oversight, often on corporate cards or through free trials that convert to paid plans. It can account for over 40% of an organization's total application count and is typically invisible to standard cost audits.
Is it better to cut SaaS costs quickly or run a structured optimization process? Quick cancellation delivers fast savings but often triggers a second-quarter backlash as teams quietly re-procure tools they needed, usually at worse pricing. Structured optimization takes longer to show full results but sustains 20% to 30% savings over time.
What is a SaaS optimization tool? Software that connects to SSO, HR, and finance systems to automatically map an organization's full application portfolio, track usage at the license level, flag underutilized seats, and manage renewal timing.
Do we need a SaaS optimization tool, or can we manage this with a spreadsheet? A spreadsheet can work for smaller portfolios, generally under 30 to 50 applications. Past that scale, manual tracking cannot keep pace with monthly changes, and a dedicated platform typically pays for itself within the first quarter through license reclaim alone.
How often should we review our SaaS portfolio? Monthly spend reviews and a full quarterly portfolio review are the benchmark cadence among companies that sustain savings rather than losing them back to sprawl within a year.
Who should own SaaS cost optimization inside a company? A cross-functional group with IT, finance, and business unit representation. IT alone typically controls only a small share of total SaaS spend, so optimization led solely by IT misses most of the portfolio.
What is application rationalization? The process of categorizing every application in use, identifying tools with overlapping functionality, and standardizing on one platform per function to eliminate redundant spend.
How do we negotiate better SaaS renewal pricing? Start the conversation 90 to 120 days before renewal, bring your own usage data, and reference market pricing benchmarks rather than accepting the vendor's first quote. Benchmarking data shows the majority of initial vendor quotes exceed fair market value.
What is the biggest single source of SaaS waste? Unused and underutilized licenses, typically accounting for a quarter to nearly a third of total spend, ahead of redundant tools, shadow IT, and vendor overpricing.
How quickly can we expect to see savings from SaaS optimization? Most organizations see measurable ROI within 60 to 90 days of starting a structured process, with license reclaim from the first pass often exceeding any platform cost in the same quarter.
Does SaaS cost optimization hurt productivity? Not when done through classification rather than blanket cancellation. Sorting tools into critical, supporting, and optional categories before cutting anything protects the systems teams actually depend on.
What governance steps prevent SaaS sprawl from coming back? A purchase approval workflow requiring business justification above a defined spend threshold, combined with a recurring quarterly review, is what keeps a cleaned-up portfolio from drifting back into sprawl.
How does AI pricing affect SaaS cost optimization in 2026? AI features are driving renewal price increases of 20% to 37% in many contracts, and 78% of IT leaders report unexpected charges tied to consumption-based or AI pricing models, making proactive renewal review more important than in previous years (Source: Varisource, 2026; BridgeApp, 2026).
Conclusion
The $50,000 to $200,000 figure is not a scare number. It is what the math produces once you apply industry-standard recovery percentages to a typical mid-market SaaS budget, and for larger enterprises the exposure runs into the millions. The companies that capture that money are not the ones that cancel the most licenses fastest. They are the ones that build visibility first, classify before cutting, and put a governance gate in place so the savings actually hold twelve months later.
Next step: if you cannot say with confidence what your true annual SaaS spend is, including the tools finance does not know about, that is the place to start. Applify's cloud optimization team can run a structured audit alongside your existing AWS environment to show exactly where spend is leaking before you commit to a platform or a policy change.
If mismatched dashboards and conflicting numbers are part of the problem too, that's usually a data chaos and ownership issue more than a tooling one, and it's worth the fifteen minutes to read the free guide.
.png)